Cross-sport variance mapping: how fixture congestion cycles alter selection probabilities in soccer midweeks, tennis back-to-backs, and racing double-headers
Written by Noah Fischer · Aug 20, 2026
Cross-sport variance mapping: how fixture congestion cycles alter selection probabilities in soccer midweeks, tennis back-to-backs, and racing double-headers
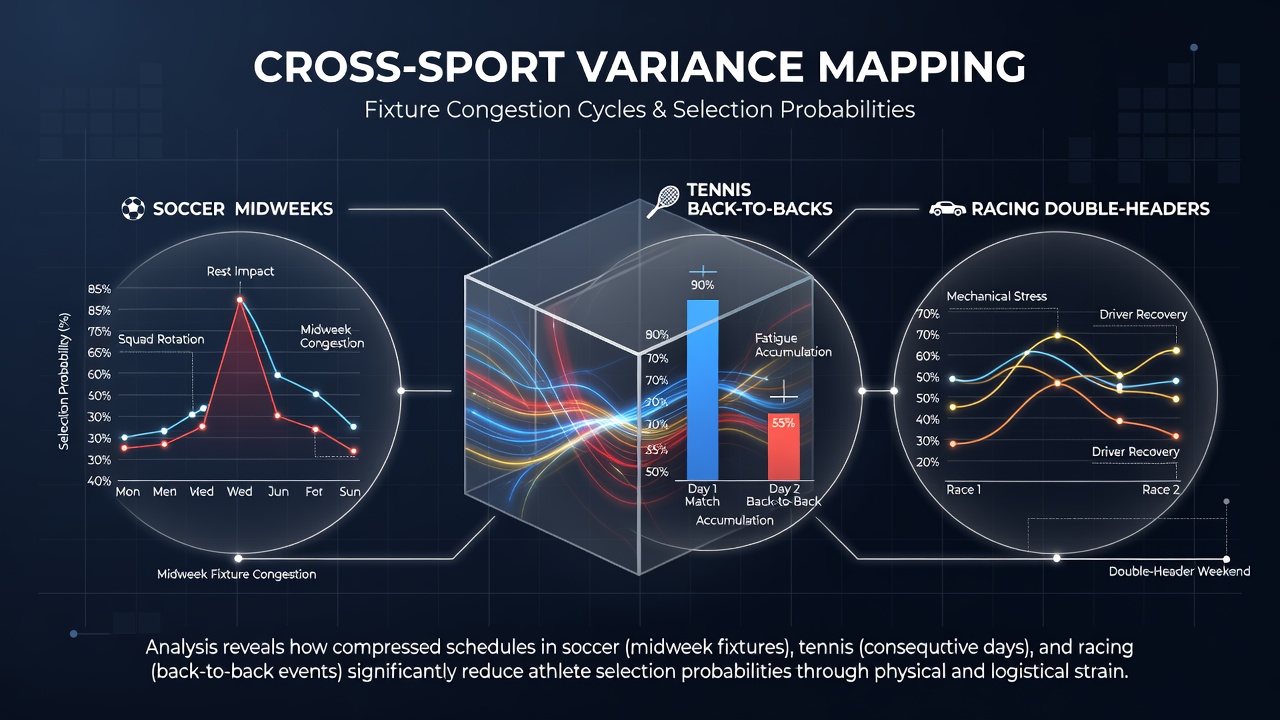
Fixture congestion creates measurable shifts in athlete availability and performance metrics across multiple sports, and analysts track these patterns through variance mapping techniques that quantify changes in selection probabilities during high-density periods. In soccer, midweek European fixtures often follow weekend league matches, which forces coaches to adjust lineups based on recovery data collected from GPS tracking systems and heart rate monitors. Researchers at institutions such as the University of Melbourne have documented how these cycles influence squad rotation decisions, particularly when teams face three matches in eight days.
Soccer midweek congestion patterns
League schedules in the 2025-2026 season already showed clusters of midweek commitments during August and September blocks, where domestic cups overlapped with continental competitions, and data from match analysis platforms indicates that starting eleven selections change by an average of four to six players compared to standard weekend lineups. Teams in the English Premier League and Bundesliga demonstrate consistent patterns where full-backs and central midfielders receive the most frequent rest, because positional demands on repeated high-intensity runs increase injury risk markers tracked by sports science departments. Observers note that probability models built from historical lineups adjust selection odds upward for squad players who typically feature in domestic cups but sit out European ties when recovery windows shrink below seventy-two hours.
Tennis back-to-back scheduling effects
Tennis calendars place back-to-back tournaments on different surfaces within the same fortnight, and this structure alters player participation rates in ways that variance models capture through withdrawal statistics and ranking point distributions. During the North American hard-court swing that precedes the US Open, several players in the top fifty face consecutive weeks of best-of-three matches followed by immediate travel to the next event, and ATP data reveals that main-draw acceptance rates drop for athletes who competed in the prior tournament's later rounds. Studies compiled by the International Tennis Federation show that players who reach semifinals or finals one week experience a measurable decline in win probability the following week when surface transitions occur, particularly when moving from outdoor hard to indoor hard or clay. Tournament directors publish entry lists weeks in advance, yet last-minute withdrawals spike during August clusters because recovery protocols require extended rest that conflicts with consecutive tournament commitments.
Racing double-header dynamics
Horse racing schedules incorporate double-headers at major tracks where meetings occur on consecutive days, and these arrangements affect trainer and jockey selection patterns tracked through form databases maintained by racing authorities. In Australia, the Melbourne Racing Club and Victoria Racing Club calendars place several August dates with back-to-back cards at Flemington and Caulfield, which requires horses to either run twice in quick succession or sit out one meeting entirely. Jockey booking records indicate that leading riders spread mounts across both days when possible, yet probability assessments for specific horses shift when trainers opt for spacing rather than consecutive runs because historical performance data shows reduced strike rates on second-day starts without adequate recovery. Handicappers adjust weight assignments and barrier draws based on these documented cycles, creating updated probability matrices that account for double-header fatigue variables.
Integrated variance mapping across disciplines
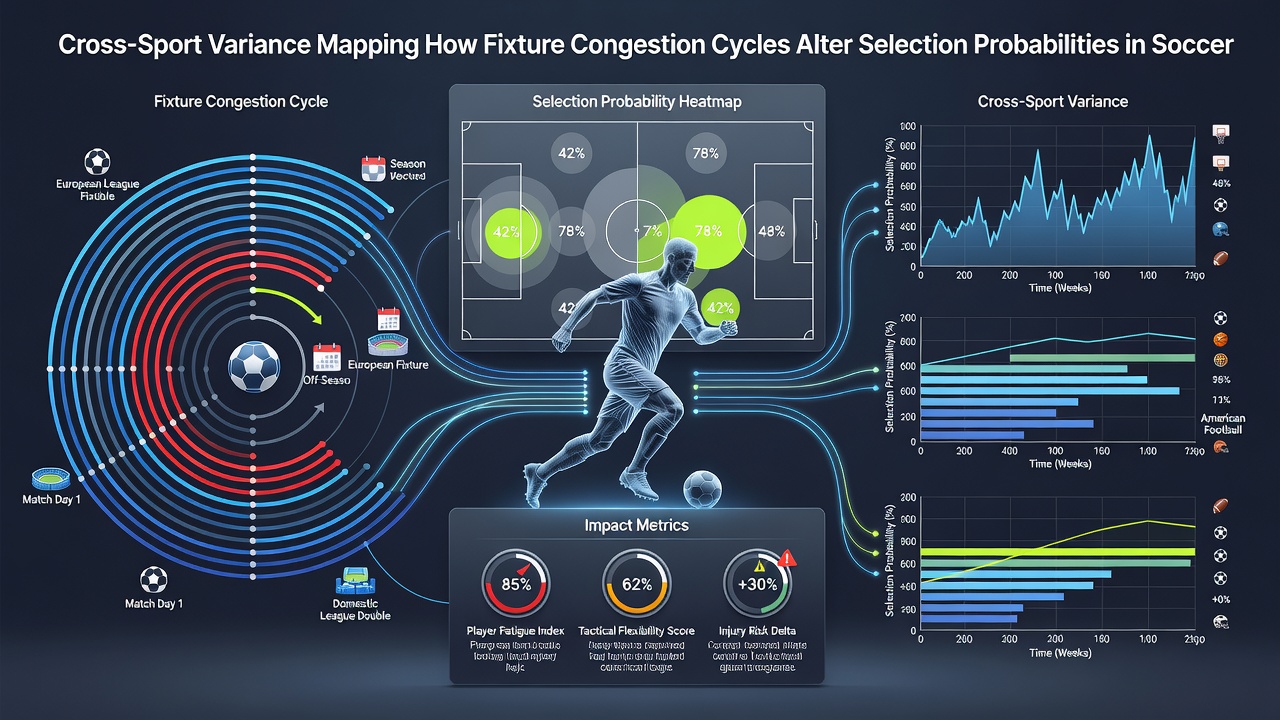
Cross-sport models combine these individual datasets into unified frameworks that identify overlapping congestion windows, and such mapping reveals periods when multiple sports experience simultaneous schedule pressure. August 2026 contains several such overlaps where soccer midweek rounds coincide with tennis hard-court swing events and racing double-headers in Europe and Australia, which allows analysts to compare selection probability adjustments across domains using standardized metrics such as rotation percentages and participation rates. Organizations including the European Sports Science Network have published reports that outline how these concurrent cycles affect betting market efficiencies through updated player and horse availability information released by governing bodies. The models incorporate variables like travel distance, surface changes, and recovery time windows, then generate adjusted probability outputs that reflect real-world lineup and field alterations rather than static form assessments.
Those who maintain these variance maps update inputs weekly from official schedule releases and performance tracking systems, which ensures the calculations remain aligned with current fixture lists. Data aggregation platforms pull from soccer league websites, tennis tournament entry systems, and racing authority databases to produce comparative outputs that highlight when congestion effects intensify or moderate across the three sports. Patterns emerge most clearly during international breaks and major tournament transitions, where the density of fixtures forces systematic changes in selection behavior that probability models quantify through longitudinal analysis.
Conclusion
Variance mapping therefore functions as a practical tool that translates fixture congestion into quantifiable shifts in selection probabilities, and the approach draws on established data sources from soccer governing bodies, tennis federations, and racing authorities to maintain accuracy across different calendar periods. Continued refinement of these models depends on consistent reporting of lineup changes, withdrawal statistics, and performance indicators that each sport already collects through standardized protocols.