Fixture Congestion Effects on Performance Indicators Across Soccer Leagues, Tennis Tours, and Racing Circuits
Written by Noah Fischer · Jun 13, 2026
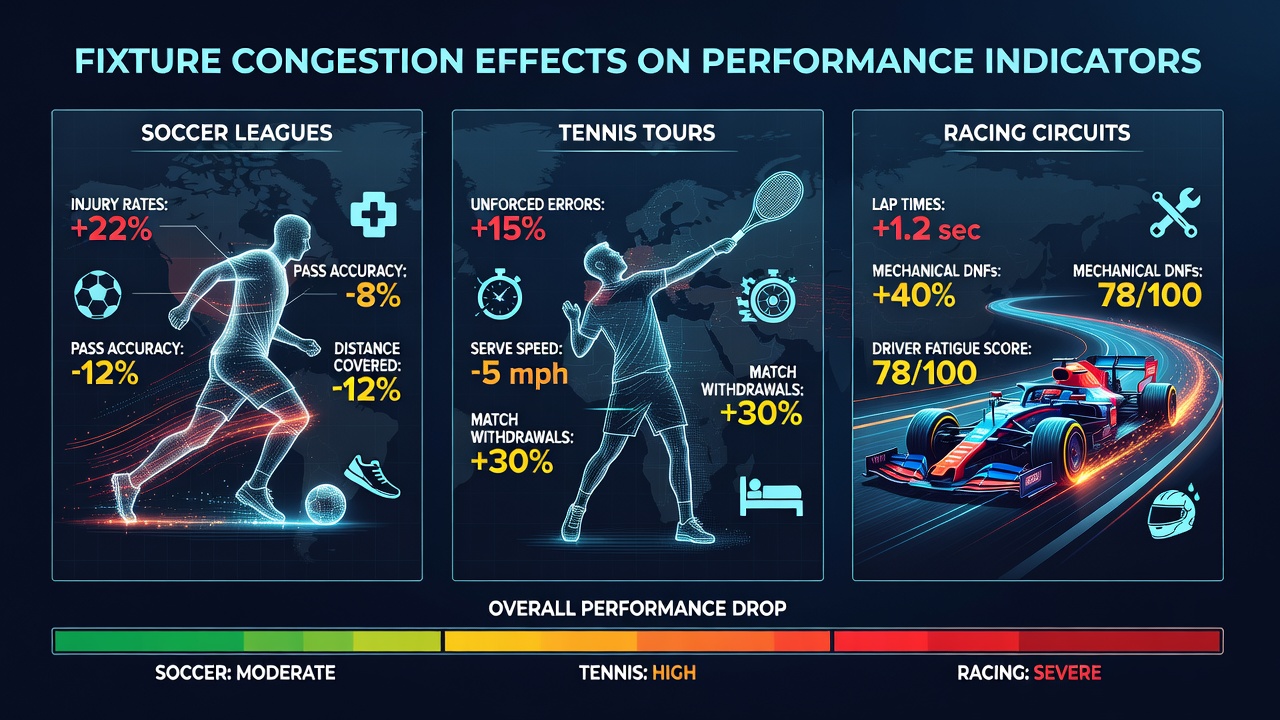
Fixture Congestion Effects on Performance Indicators Across Soccer Leagues, Tennis Tours, and Racing Circuits
Fixture congestion arises when athletes and teams face compressed schedules that reduce recovery time between matches or races, and researchers track its influence on metrics such as win percentages, injury rates, and speed records across multiple sports. Data from league databases and tour statistics show measurable shifts in these indicators during periods of high fixture density, particularly when travel demands compound physical loads.
Soccer Leagues and Schedule Density
European domestic leagues and international competitions create overlapping calendars that place clubs under sustained pressure, and studies from sports science departments indicate elevated muscle strain markers in players logging more than one match every four days. League tables compiled by governing bodies reveal that teams competing in domestic cups alongside continental tournaments record higher rates of non-contact injuries during December and January blocks. Performance logs from major competitions demonstrate that goal conversion rates decline by measurable margins when squads rotate fewer than three days between fixtures, while defensive error counts rise in the same windows.
Analyses covering the English Premier League and Bundesliga document that players accumulate greater total distance covered yet post lower high-intensity sprint outputs when fixture gaps shrink below seventy-two hours. Medical staff reports submitted to league authorities note increased hamstring and ankle complaints in these intervals, and longitudinal tracking shows that squads with deeper benches maintain steadier points-per-game averages than those relying on core lineups. In June 2026 several leagues will navigate post-European Championship recovery periods that coincide with pre-season friendlies, creating another cluster of short-turnaround games for clubs whose players participated in national-team duties.
Tennis Tours and Consecutive Events
ATP and WTA calendars pack ranking events into tight geographical clusters, and match-play data collected by tour statisticians show that players contesting three tournaments inside fourteen days register drops in first-serve percentages and return-point win rates. Tournament records indicate elevated retirement rates during the European swing when surface changes and travel time compress preparation windows. Researchers examining heart-rate variability in professional players have recorded slower recovery curves after best-of-five matches followed by rapid relocation to the next venue.
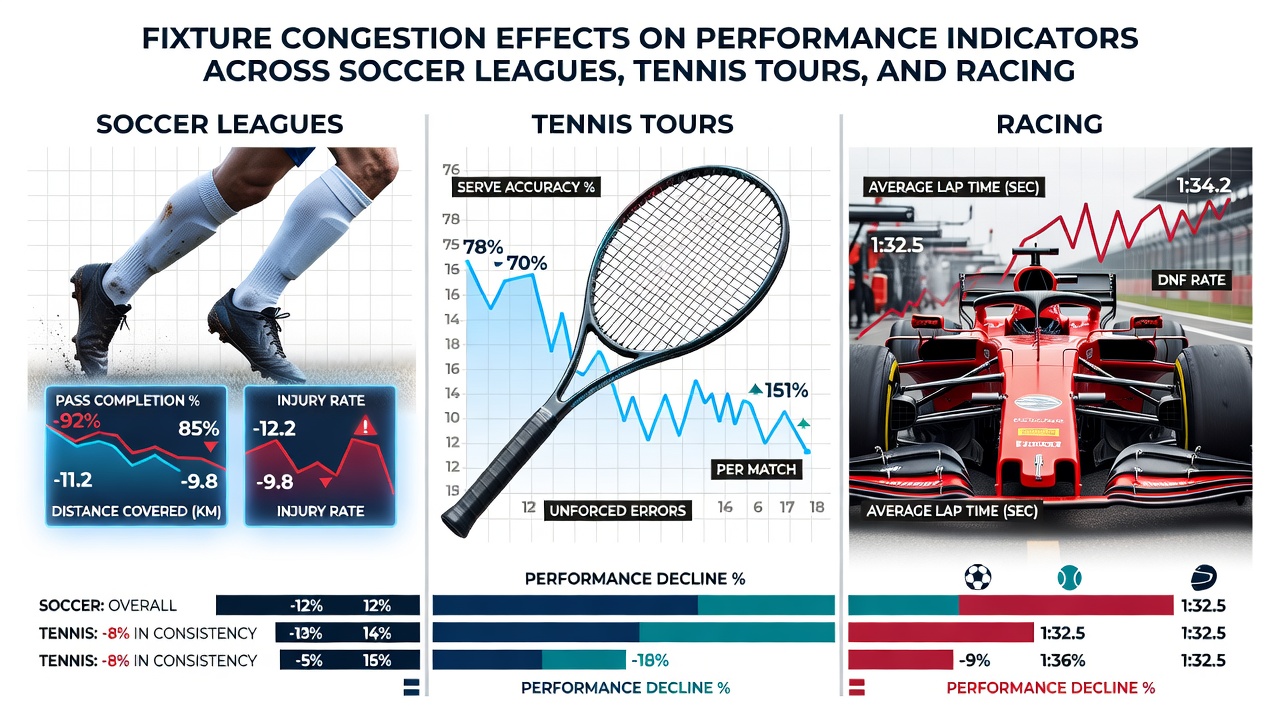
Performance databases maintained by the International Tennis Federation illustrate that qualifiers advancing through multiple rounds before entering main draws exhibit reduced win percentages in subsequent elimination matches. Observers monitoring junior and ITF circuits note similar patterns where young competitors balancing school commitments with tournament blocks display larger fluctuations in unforced-error counts. Governing bodies have adjusted some 2026 schedules to insert additional rest days after Grand Slam events, yet regional challenger events continue to operate on tighter intervals that test recovery protocols.
Racing Circuits and Multi-Race Load
Thoroughbred and harness racing calendars schedule meetings across consecutive days at regional tracks, and veterinary records submitted to racing authorities document increased soft-tissue injury incidence when horses run within five days of a prior start. Speed figures compiled by industry analysts show that animals contesting three races inside ten days post lower average sectional times in the final furlong compared with those granted longer intervals. Trainer logs indicate that horses traveling between jurisdictions for graded stakes experience compounded fatigue when quarantine and transport logistics shorten rest periods.
Formula 1 and other motor-racing series face analogous pressures during triple-header weekends, and telemetry datasets released by teams reveal elevated tire-degradation rates and brake-temperature spikes when cars complete practice, qualifying, and race duties on successive days. Pit-crew performance metrics tracked by series officials display small but consistent increases in reaction-time variability during the third event of such clusters. In June 2026 several flat-racing festivals will overlap with international horse-transport windows, prompting regulatory bodies to monitor cumulative starts per horse more closely.
Cross-Sport Patterns in Recovery Metrics
Comparative reviews published by sports-medicine journals highlight that all three domains exhibit parallel declines in key performance indicators once recovery windows fall below sport-specific thresholds. Soccer and tennis data converge on reduced neuromuscular output after repeated high-intensity efforts with limited sleep, whereas racing records emphasize musculoskeletal wear from repetitive loading. Training-load monitoring systems adopted by professional organizations now integrate GPS, heart-rate, and blood-marker inputs to flag athletes approaching congestion-related risk thresholds.
Academic partnerships with league operators have produced open-access datasets that allow independent researchers to correlate fixture density with objective outputs such as expected goals, serve-win percentages, and race times. These repositories show that the magnitude of performance drop varies by age cohort and prior workload, yet the directional effect remains consistent across codes.
Conclusion
Performance-indicator databases across soccer leagues, tennis tours, and racing circuits document that fixture congestion correlates with measurable shifts in physical output, injury incidence, and competitive results. Continued collection of standardized metrics by governing bodies and research institutions supports ongoing calibration of schedules and recovery strategies to align with observed physiological demands.